ECS System Simulation Architecture and Performance Optimization from the Early Phases of the System Design
In today's aircraft thermal design, we can observe a trend towards electronics systems integration characterized by higher heat densities and a more frequent use of composite primary structures. All these factors require robust thermal management and thermal architecture design already at the preliminary design stages. The thermal architecture will have to be developed in order to mitigate thermal risks for temperature-sensitive equipment as well as to limit the aircraft systems overdesign. The improvement and optimization of the thermal architecture is regarded as one of the key success factors for future aircraft developments. It requires a complete pyramid of simulation tasks to be set up, from the individual equipment to aircraft section simulation, to the global aircraft thermal analysis. Many difficulties arise from this simulation framework due to the variety of physical models, partners, techniques and tools used at each level of the pyramid.
In this context, the aim of this paper is to describe an Environmental Control System design approach as applied in Alenia Aermacchi. The main technical challenges addressed in this paper are:
- Air conditioning pack architecture design
- Air distribution line design and trade-off study,
- Multidisciplinary optimization of the air distribution system components
- A/C cabin thermal environment evaluation and occupants' thermal comfort.
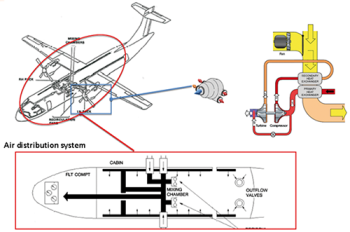
Fig. 1 - Assembly (rear view)
Background
The air conditioning system is designed in such a way that it maintains the air within the pressurized fuselage compartment at the required level of pressure, temperature, flow rate and purity. The air is supplied to the system from the engine compressor, the hot compressed air is cooled and conditioned in the air conditioning pack before being distributed to the various compartments through the air conditioning system (see Figure 1).
Accordingly, in order to guarantee a comfortable A/C cabin environment, it is necessary to design and optimize the air conditioning pack and air distribution system.
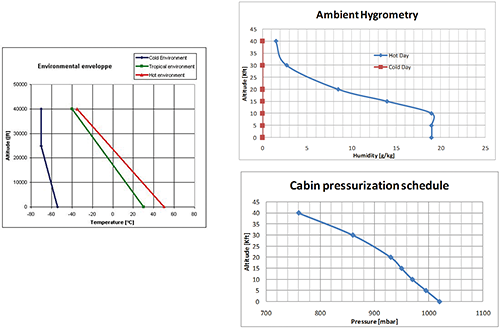
Fig. 3 - Environmental envelope
Table 1 - Electrical equipment dissipated power
Air conditioning pack architecture design
Requirements
This study focuses on the following requirements:
- A/C schematic configuration (see Figure).
- Thermo-acoustic insulation U factor.
- Electrical equipment dissipated power (see Table 1).
- Temperature requirements for cabin/ cockpit.
- Environmental envelope (see Figure 3).
- The certification and performance requirements of ECS are reported below:
- Minimum fresh flow per passenger: 0.55 lb/min.
- Minimum fresh flow per crew member: 10 cfm.
- Minimum fresh flow per galley 15 cfm.
- Maximum ratio recirculation / total flow 0.4.
- Maximum fresh flow per passenger/crew member for single pack operations 0.4.
- Cabin stabilized temperature between 21°C -27°C.
- Cockpit stabilized temperature between 21°C-27°C.
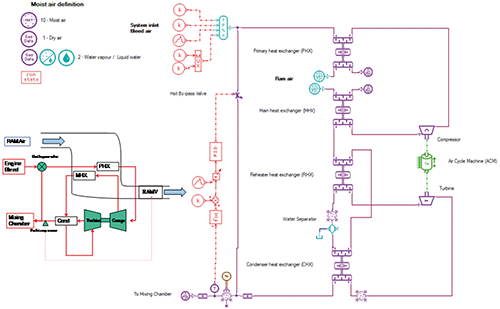
Fig. 4 - ECS pack 1D- model
Methodology
The design of the air conditioning pack architecture has been reached through the following steps:
- Definition of air conditioning pack monodimensional model.
- Definition and validation of heat exchanger mono-dimensional model.
- Definition of A/C cabin thermal monodimensional model.
- Optimization of heat exchanger design, in order to meet certification and performance requirements.
As shown in Figure 4, the standard air condition pack architecture has been considered. Figure 4 illustrates also the mono-dimensional model built in LMS Amesim. The heat exchanger mono-dimensional model (low fidelity model) has been validated by comparing its results with CFD model results (high fidelity model). In Figure 5, we can see the validation analysis results.
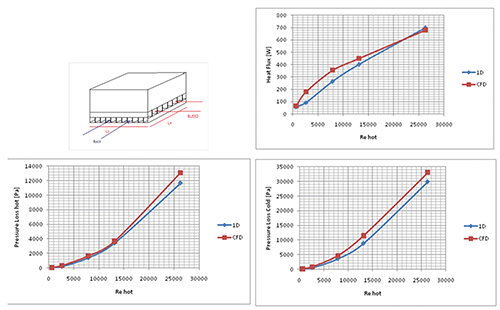
Fig. 5 - Heat exchanger size
In order to design the air cycle machine and heat exchanger, the cabin aircraft mono-dimensional thermal model shown in Figure 6 has been built. It allowed to evaluate the cabin thermal environment and hence the compliance with varying pack performance depending on the heat exchanger design. The operating conditions analysed have been:
- Steady state, ground hot day (ISA+25, 100% passengers)
- Steady state, ground cold day (ISA-55, 20% passengers)
- Steady state, cruise hot day (40 kft, -35°C, Mach 0.85, 100% passengers)
- Steady state, cruise cold day (40 kft, -70 °C, Mach 0.85, 20% passengers)
Fig. 6 - A/C mono-dimensional thermal model
The heat exchanger has been defined in terms of its geometrical characteristics and number of plates. As shown in Figure 7, the analysis results confirm the compliance of the air conditioning pack architecture with the certification and performance requirements.
Air distribution line design and trade-off study
In order to determine the air conditioning pack architecture, the second step focused on the definition of the air distribution system. The latter depends on the following aspects:
- Performance in terms of pressure losses.
- Integration in aircraft.
- Reliability and maintainability.
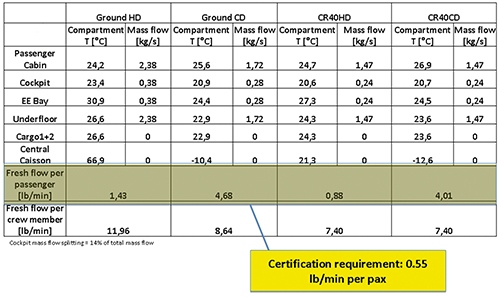
Fig. 7 - Performance of air conditioning pack
Two different architectures have been analyzed. The first one (Architecture A) shown in Figure 8 is a parallel architecture composed of an underfloor line and a low pressure air distribution line that allow to distribute the airflow coming from the mixing chamber in parallel through the risers.
The second one (Architecture B) shown in Figure 9 is a sequential architecture where the under floor is much limited, and the cabin air distribution system is developed above the floor.
Fig. 8 - Air distribution system CAD model – Architecture A
Starting from the CAD model shown above, a monodimensional model for each architecture has been built in LMS Amesim (see Figures 10 and 11). The mono-dimensional models are composed of the following parts:
- Connection with air conditioning pack mono-dimensional model.
- Cockpit line
- Cabin line
- Simplified A/C thermal model as thermal node.
- Internal macro that allows to simulate the physiology of the passengers in terms of heat load and humidity released.
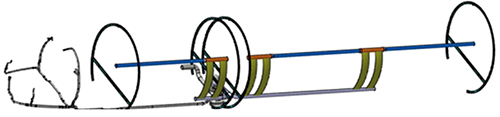
Fig. 9 - Air distribution system CAD model – Architecture B
As boundary conditions we assumed the data reported below in various flight conditions, then the steady state analysis has been carried out: • Temperature, air flow, pressure and humidity coming from the air conditioning pack.
- External conditions in terms of temperature.
- Equipment and light heat load.
- Passengers heat load.
Figure 12 shows the analysis results in terms of pressure drop vs mass flow curve. In particular, the results highlight that the air distribution system pressure losses of Architecture A are higher than those of Architecture B.
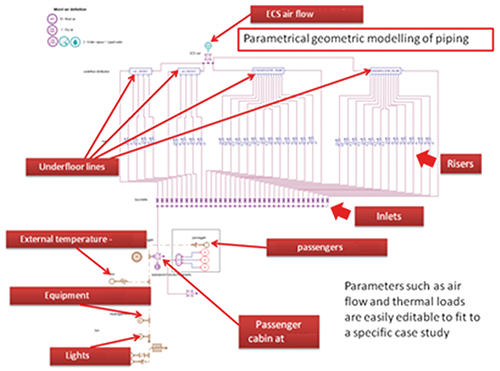
Fig. 10 - Mono-dimensional model Architecture A.
A comparison analysis has been performed by means of a Technical Performance Measure (TPM) methodology. First, all of the key requirements (performance, system integration in the aircraft, RMT) have been defined, categorized and weighted according to their degree of importance. Key factors and preferences have been established on the basis of Alenia's experiences. Normalized weights of 0-1 range have been assigned as per the above to each key requirement. Then, each requirement has been split into sub-requirements, as follows:
- Performance: o Pressure loss.
- System Integration in the aircraft:
- Influence on cabin noise;
- Weight;
- Ease of installation.
- RMT
- Reliability;
- Maintainability.
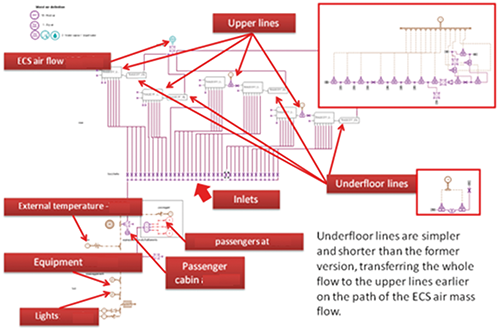
Fig. 11 - Mono-dimensional modelArchitecture B.
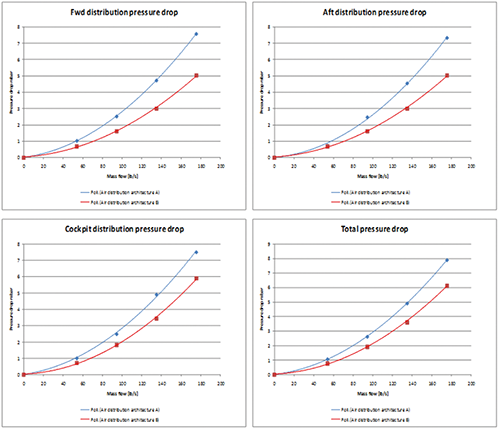
Fig. 12 - Pressure loss vs massflow curves
Each sub-requirement has been weighted according to its degree of importance compared to the others. Then, each weight has been normalized in absolute terms, in accordance with the key requirements. Also a score has been assigned to each sub-requirement, as follows:
- 1 = VERY POOR: the proposed solution does not meet the system's requirements;
- 2 = POOR: the proposed solution does not meet the system's requirements but the requirement deviation is acceptable;
- 3 = ACCEPTABLE: the proposed solution meets the system's requirements, but with some risks.
- 4= GOOD: the proposed solution meets the system's requirements.
Subsequently, attributes, weights and scores have been allocated, the quantitative frame which builds a rational evaluation has been defined, calculating the relevant weighted score for each sub-requirement. Figure 13 shows details of the TPM comparison analysis results. Following the outcome of the TPM approach, the results of architecture A of the air distribution system are preferred.
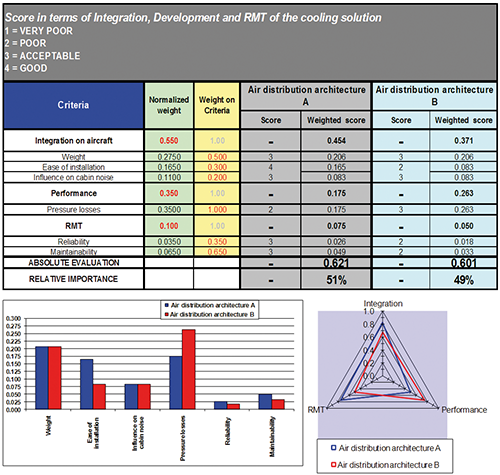
Fig. 13 - Technical performance measure
Multidisciplinary optimization of air distribution system components
The shape optimization of the air vent outlet has been carried out through the following phases:
- Mesh accuracy study
- Input sensitivity study
- Design of Experiment (DOE) Analysis
- Optimization
- Automatic updating of the party in the product
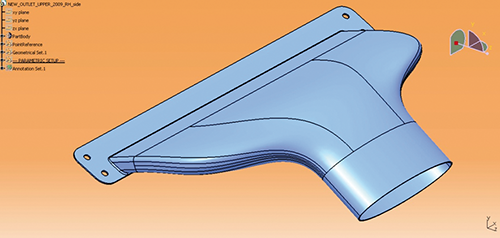
Fig. 14 - CAD model for Outlet
Design specifications
Based on the flow of incoming air assigned to the maximum operative mass flow rate, the shape of the air vent outlet has been optimized (Figure 14) with the objective of minimizing pressure losses and noise levels. To achieve these goals, the geometry for the surface connection between the inlet and outlet of the nozzle has been parameterized. Among the geometric parameters that were evaluated for the optimization is the angle Alpha; it is important to mention that this angle is formed by the axis coming from the centre of the inlet and the centre of the outlet, it changes the direction in which the air flow enters the cabin.
Parameterization
For the parameterization 6 points have been identified; these 6 points are located on the intersection of a virtual plane perpendicular to the line joining the centres of the inlet and the exit outlet. The 6 splines in Figure 15 have been initially identified as points A, B, C, D, E, F. As these point change their locations, the area of the opening will be adapted for the purpose of the optimization. Based on this configuration and by changing the location of the points, it becomes possible to update the area of the opening and in this way to modify the purpose of the optimization.
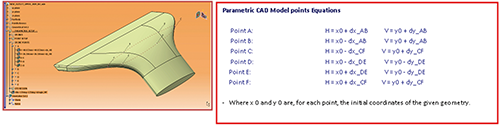
Fig. 15 - Parametric model
modeFRONTIER Model
In the modeFRONTIER model the geometric inputs are held constant while varying only the parametric data for the CAE model.
The process flow consists of three blocks:
- CATIA process: it opens the file CatiaV5 CATPart geometry of the nozzle, then it converts files into IGS and sends them to the next process.
- STAR Process: StarCCM+ runs a mesh with Base Size Length which is assigned to the CAE_Input, then it automatically performs the calculations. It estimates the time taken (CPU_Time), and sends the simulation file (SIMfile) for the next process.
- Process PostPRO: StarCCM+ checks for the simulation file, and if there are further calculations to determine the pressure and noise levels, in particular, according to the PostPRO_Input, a visual representation is saved in a jpeg file containing the pressure, the speed or noise level, as well as images of the mesh and the graph of the residue.
The variables monitored are CPU processing time in seconds, CPU_Time, and total pressures in Pascal in and out of the nozzle: p_in p_out respectively.
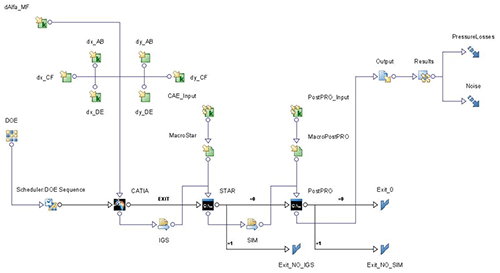
Fig. 16 - modeFRONTIER model for shape and noise optimization of the outlets
Design Of Experiment (DOE)
Analysis In modeFRONTIER (whose workflow is shown in Figure 16) a DOE analysis has been performed taking into account the 3 free parameters dx_CF, dy_AB, and dy_DE, while, dx_AB, dx_DE, and dy_CF remain constant or the abscissas of points A, B, D and E. The ordinates of tpoints C and F remain stationary as assigned by the geometry.
The range of variations of the free parametersis as follows:
- dx_CF varies from -5 mm to +25 mm in steps of 10 mm (- 5 mm, +5 mm, +15 mm, +25 mm)
- dy_AB ranges from -10 mm to +20 mm in steps of 10 mm (-10 mm, 0 mm, +10 mm, +20 mm)
- dy_DE ranges from -10 mm to +20 mm in steps of 10 mm (-10 mm, 0 mm, +10 mm, +20 mm)
The challenge of the optimization has been a multidisciplinary and multi-objective problem: the disciplines involved have been fluid dynamics and acoustics, the objectives were minimizing the pressure drop (p_in - p_out) and minimizing the level of noise emitted from outlets and walls.
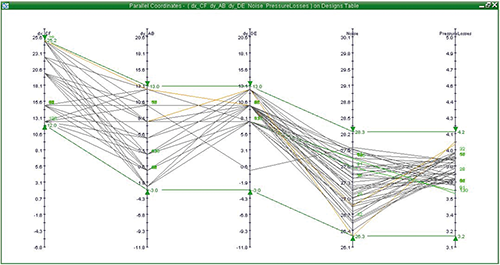
Fig. 17 - Parallel Coordinates Diagram for the restriction of the domain space of pressure loss and noise
Results
A 4 level full factorial DOE has been carried out on the 3 variables, which means that 64 configurations have been tested (43 = 64 experiments). Following are the results which represent a significant improvement to the previously adopted design. The minimum pressure drop (corresponding to the configuration process number 9) and the minimum sound level (corresponding to the configuration process number 59) are shown in Table 2. From the table, it becomes clear that the two objectives cannot be achieved simultaneously, as the minimum pressure drop is far from the minimum level of noise produced by the walls (Table 2). Therefore, the analysis moved on to a Multidisciplinary Design Optimization MDO.
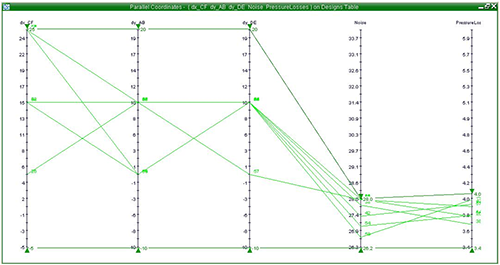
Fig. 18 - Parallel Coordinates Chart optimization
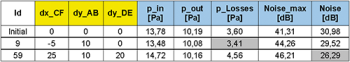
Table 2 - Table of results for optimal pressure and optimal noise reduction based on DOE
Outlet MDO
To refine the research of the investigation it has been decided to filter the results by imposing the limits of acceptance for the pressure drop in relation to the level of noise emitted from the walls. The filtering action narrowed the range of variations. This effect is shown in the filters operating diagrams in Figure 17, where the parallel coordinates were reduced to a range of 3 to 28 dB noise levels and a maximum pressure drop of 4 Pa. As before, the three parameters that vary have been dx_CF, and dy_AB dy_DE, while the other 3 parameters, dx_AB, and dx_DE dy_CF, remain constant, or the abscissas of points A, B, D and E.
- dx_CF ranges from +12.5 mm to +25.0 mm in steps of 2.5 mm
- dy_AB varies from -2.5 mm to +12.5 mm in steps of 2.5 mm
- dy_DE varies from -2.5 mm to +12.5 mm in steps of 2.5 mm
The optimization has been performed by implementing the Non-dominated Sorting Genetic Algorithm II (NSGA-II) with 10 generations in a population of 8 configurations chosen from the best, previously tested in the DOE analysis.
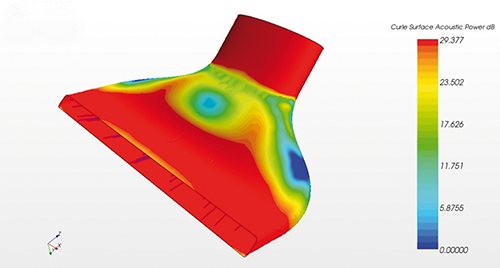
Fig. 18 - Acoustic analysis for the outlet
Results
The results of the best iteration in minimum pressure drop (corresponding to the configuration process number 130) and in minimum sound level (corresponding to the configuration process number 82) are presented in Table 3. The Parallel Coordinates in the diagram of Figure 18 illustrate the results for the r80 run configurations generated for the optimization. Figure 18 shows the acoustic FEA analysis, and Figure 19 shows the CFD pressure losses analysis.
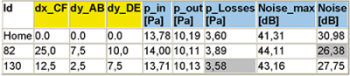
Table 3 - MDO results based on the NSGA-II analysis
Evaluation of the A/C cabin thermal environment and the occupants' thermal comfort
Once the design of the air distribution system and of the air conditioning pack were completed, the final steps have been the evaluation of the cabin thermal environment and the passengers' comfort assessment. This activity has been developed through the following steps:
- Tri-dimensional cabin thermal model development.
- Assemby of a complete mono-dimensional model.
- Comparison between the two approaches.
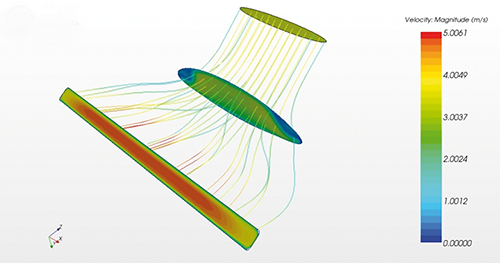
Fig. 19 - Outlet CFD analysis for pressure drop
Tri-dimensional CFD cabin thermal model
The tri-dimensional cabin thermal model has been developed in the StarCCM+ environment, through the following steps: • Domain definition: due to its symmetry, a 2 meter long section of the cabin has been analyzed.
- Mesh construction: in order to study, in adequate detail, the distribution of velocity, temperature and humidity, a polyhedral mesh (with a prism layer for turbulence treatment) of roughly 2 million cells has been constructed.
- Boundary condition definition: all operating conditions. In this paper, we show the results of the boundary conditions, they are reported in Figure 20. Furthermore, an internal macro has been developed and embedded into StarCCM+ in order to simulate the physiology of the passenger in terms of heat load and % of humidity released.
- Physics model: steady state, KEpsilon with two layers, all Y+ wall treatment, multi-phase model (air/water), segregated flow with radiation model.
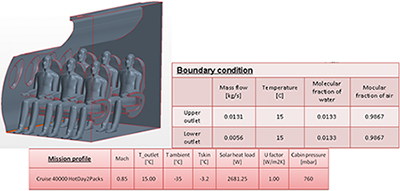
Fig. 20 - Simplified CAD model and Boundary condition
The aim of the analysis has been the study of the A/C cabin, we have analyzed and verifyied the following parameters:
- Velocity field (see Figure 21)
- Relative humidity pattern (see Figure 22)
- Temperature pattern in cabin zones (see Figure 23).
- Cabin average temperature
Passenger comfort requirements imposed by the aeronautical rules are:
- Differential temperature between aft and forward side are not to exceed 2°C
- Differential temperature between head and feet are not to exceed 3°C
- Differential temperature between left and right side are not to exceed 2°C.
Considering as boundary conditions the data reported in Figure 20, our CFD model provides the following results:
- Average relative humidity: 36.37%
- Cabin average temperature: 23.8°C
- As shown in Figure 23, the compliance with comfort requirements described above could be guaranteed.
Complete ECS system mono-dimensional model.
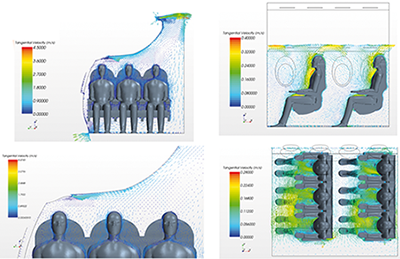
Fig. 21 - Velocity field
The complete mono-dimensional model has been obtained by linking the air conditioning pack model (see Figure 4) with the air distribution system model (see Figure 10), and with the A/C thermal model shown in Figure 6. The aim of the analysis was to study the A/C cabin thermal environment, analyzing and verifying the following parameters:
- Average relative humidity
- Cabin average temperature
The analyses have been performed at different A/C and flight conditions. Considering as boundary conditions the data reported in Figure 20, our mono-dimensional model delivered the following results:
- Average relative humidity: 40%
- Cabin average temperature: 24.1°C.
Results
In order to evaluate the mono-dimensional model results (low fidelity model), its results have been compared with the CFD tri-dimensional model results (high fidelity model). The performed analysis has highlighted that the average temperature calculated with the CFD analysis is comparable with the average temperature calculated with the mono-dimensional model, assuming the same input conditions. The CFD model allowed to obtain a detailed evaluation of the cabin thermal environment, the temperature stratification, the stagnation zones, and the thermal environment near the passengers for evaluating the status of the passenger comfort. The mono-dimensional thermal model allowed, in a sufficiently accurate way, to obtain a fast evaluation of the cabin thermal environment in terms of average temperature and % of humidity.
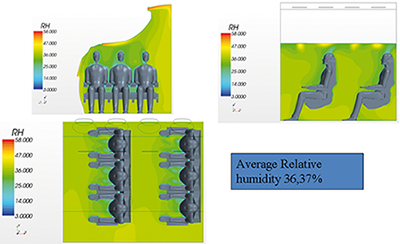
Fig. 22 - Relative humidity pattern
Conclusions
Various new frontiers are currently emerging in the aerospace industry. They require new initiatives and approaches for the role of engineering design and analysis, mainly due to the profound knowledge of the importance of cross-firms and cross-disciplines collaboration in large scale engineering design processes, such as aircraft design. This kind of collaboration and interaction is now more possible than ever before due to the current state of digitization of engineering design data, an IT infrastructure that enables a universal communication of data, the current engineering platforms which support collaboration, and the increasing computational power, which allows us to integrate multidiscipline, multi-physics and engineering data in one shared environment. This state-of-art design environment is leading to a new opportunity, and to a challenge. As the present study shows, process integration between different design disciplines is an essential factor for automating design processes.
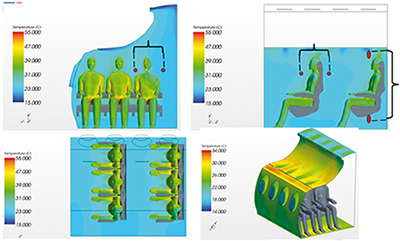
Fig. 23 - Temperature pattern
The design process presented in this paper is actually used in the Environmental Control System department of Alenia Aermacchi, where fluid dynamic problems are approached with innovative tools and innovative methodologies that allow to define the architecture and to optimize the performance from the early stages of the system design. The described approach allowed to achieve the following reported goals:
- Reduction/elimination of physical tests and related costs during the development phase.
- Minimization of certification tests.
- Minimization of risks and costs linked to the re-design of parts in the manufacturing phase.